
Data Annotation QA: Checklist and Tools for Training Datasets
 Lisa UspenyevaUpdated
A data annotation QA checklist for computer vision datasets: what to check, which numbers to track, and how to find label errors with interactive statistics.
Data annotation QA checks that the labels in a training dataset are correct, complete and consistent before model training. A good process has five steps: check class balance, review dataset statistics for outliers, review a random sample, compare annotators, and compare model predictions with labels. Supervisely covers each step in one platform.
This guide gives a QA checklist, shows which tool does which check, and walks through Supervisely's interactive statistics on the Pascal VOC dataset. For the full feature reference, see the QA and statistics docs.
Why does annotation QA matter?
Label errors are common even in famous datasets. Northcutt, Athalye and Mueller estimate at least 3.3% label errors on average across the test sets of 10 widely used datasets, and at least 6% in the ImageNet validation set. A model trained and tested on noisy labels learns the noise, and its benchmark scores can mislead you.
QA catches these problems while they are cheap to fix.
What is the data annotation QA checklist?
Run these checks on every dataset, and again after every new batch of labels.
- Class balance. Count images and objects per class. Find classes that are rare or dominant.
- Missing labels. Find images with no annotations, and images with fewer objects than expected.
- Wrong labels. Open random images per class and check that the label matches the content.
- Geometry. Check object sizes and positions. Very small, very large or duplicated objects are often mistakes.
- Guideline compliance. Check that classes and tags follow the labeling guide, including edge cases.
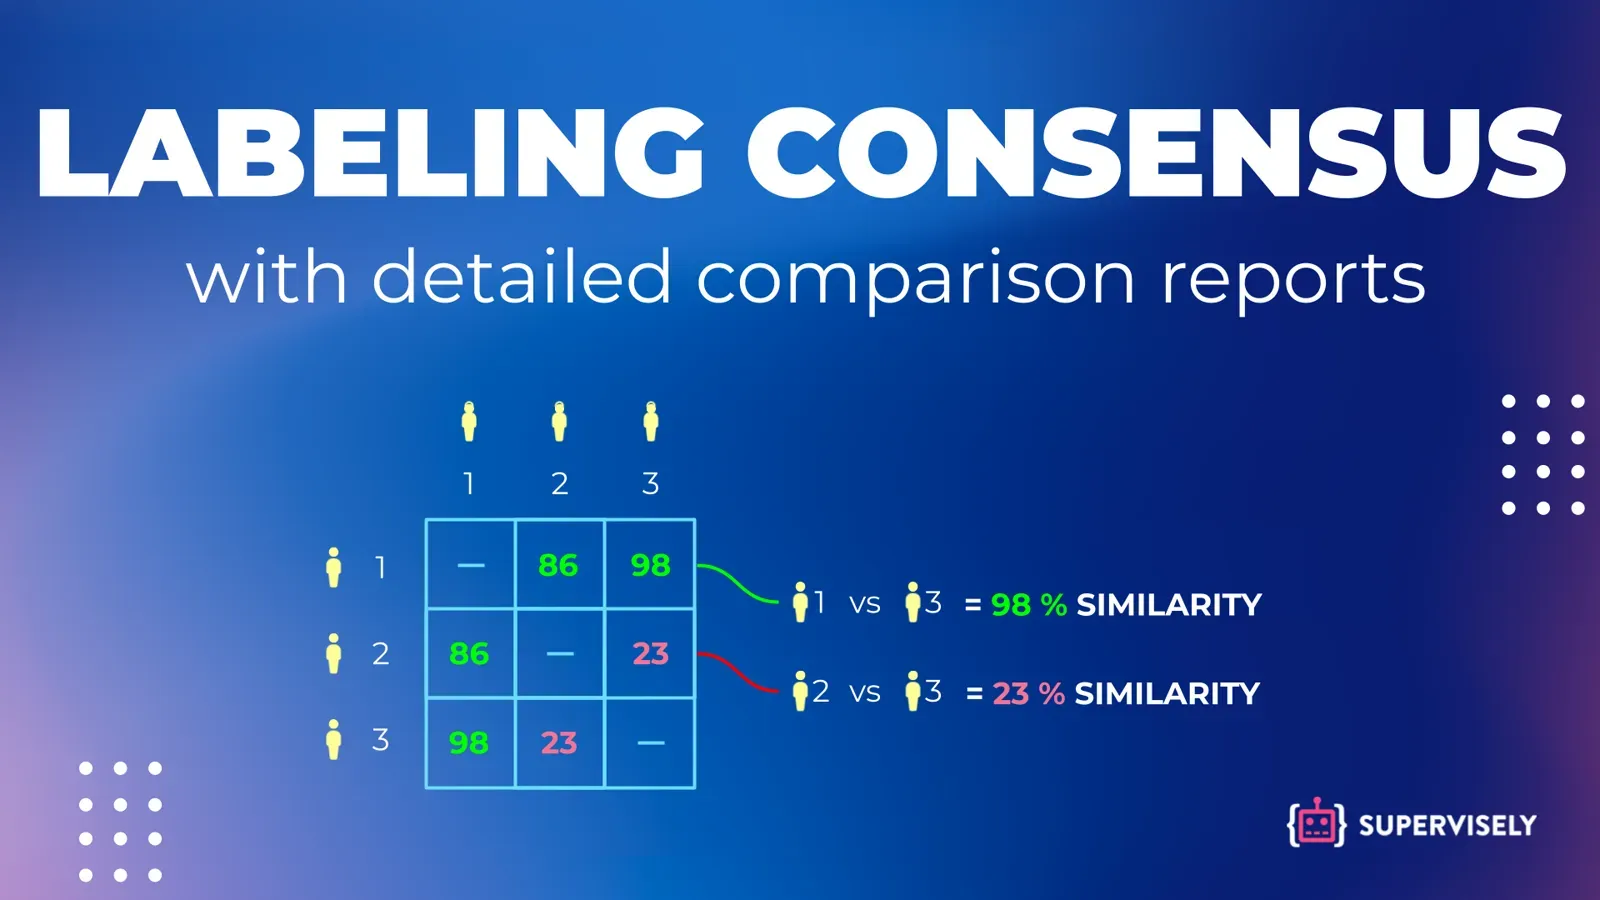
- Annotator agreement. Have two or more people label the same sample and measure agreement. See inter-annotator agreement metrics.
- Reviewer sign-off. A second person accepts or rejects a random sample, and you track the accept rate.
- Model check. Compare predictions with ground truth. Systematic disagreement often points to label errors.
- Re-check after changes. Re-run statistics after merging, filtering or relabeling data.
Which QA tool does which check?
| Check | What to measure | Where in Supervisely |
|---|---|---|
| Class balance | Images and objects per class | Statistics tab: Class Balance |
| Missing and extra objects | Objects per image | Statistics tab: Object Distribution, Per Image Statistics |
| Wrong class | Class pairs on the same image | Statistics tab: Co-Occurrence Matrix |
| Odd geometry | Object area, height and width | Statistics tab: Class Sizes, Objects Properties, Spatial Heatmap |
| Annotator quality | Agreement score per pair | Labeling consensus app |
| Reviewed quality | Accept or reject per object | Labeling jobs and quality control |
| Automatic label error detection | Likely mislabeled items | External: cleanlab, open source |
Supervisely's quality control sends a random sample of images to reviewers. The Stats button then reports Geometric Accuracy, Class Accuracy, Tags Accuracy and Annotations Recall (see the docs). If you want fully automatic label error detection in your own pipeline, cleanlab is a strong open-source option and supports classification, object detection and segmentation.
How do interactive statistics work in Supervisely?
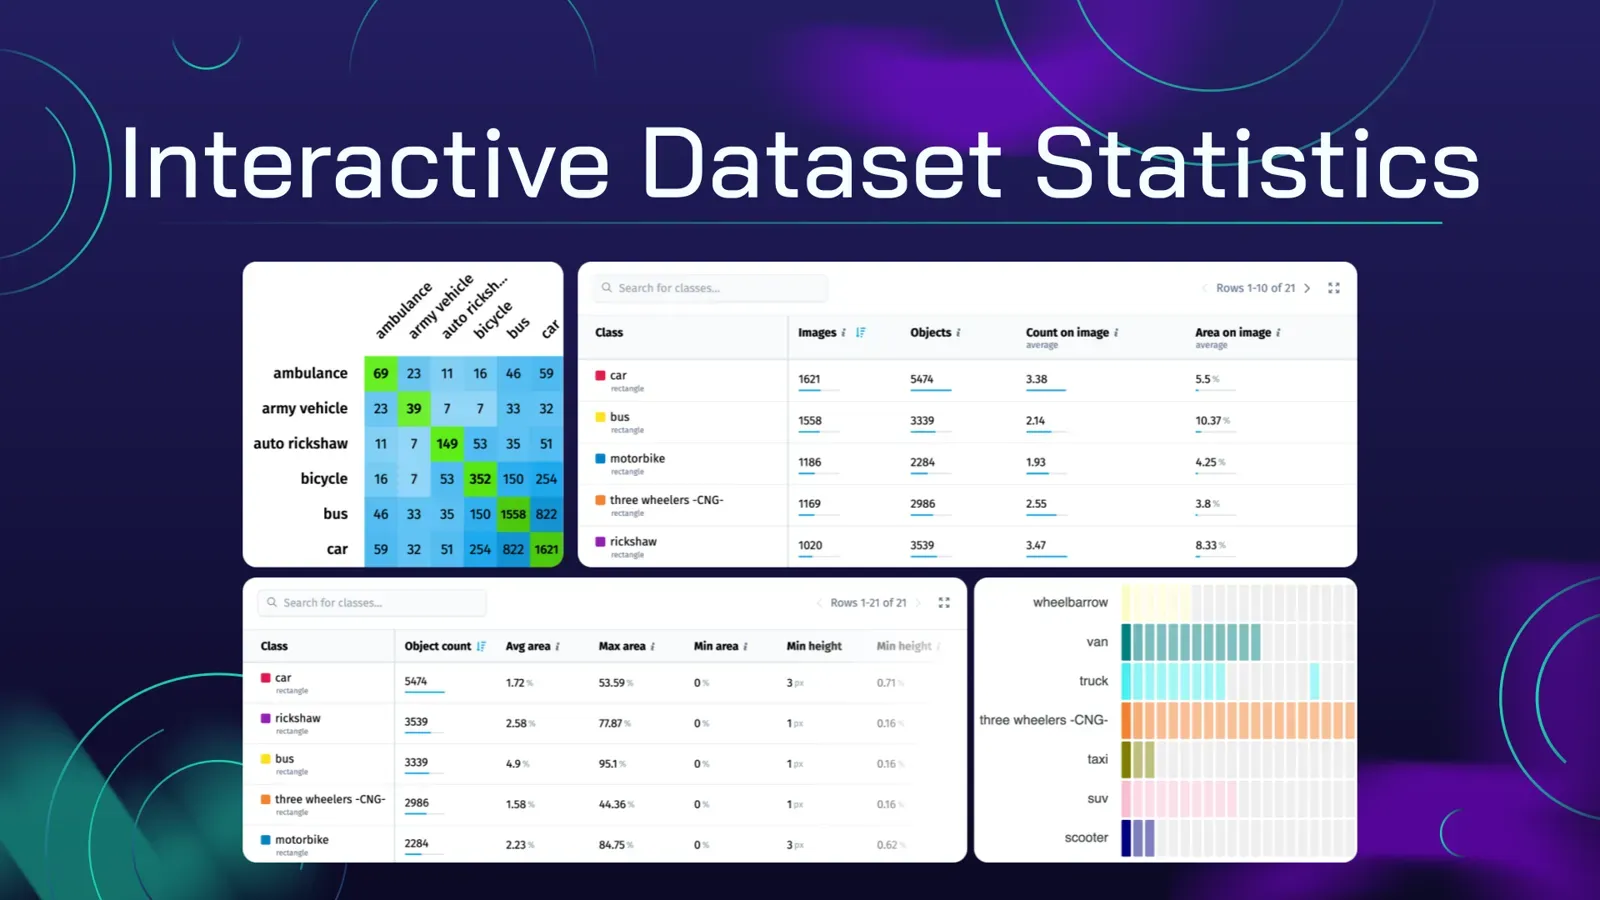
This feature set was built for dataset analysis and QA on custom computer vision datasets. In this tutorial you will use the statistical views to find anomalies, annotation outliers and distribution problems.
The views covered below:
- Class balance: the distribution of classes in your dataset.
- Co-occurrence matrix: relationships between classes.
- Image statistics: details about images and their objects.
- Object distribution: how many objects each image has.
- Class sizes: sizes of objects of every class.
- Spatial heatmap: where objects of each class usually appear.
- Object statistics: characteristics of individual objects.
- Other statistical measures: additional dataset properties.
Video: how to use the QA statistics
This 4-minute video guide covers new interactive quality assurance tools and automatic statistics for custom computer Vision datasets in Supervisely.
Learn here about the benefits of interactive statistics, including training datasets quality assurance, exploring and validating annotations, visualizing data distribution, detecting outliers, finding labeling errors, and evaluating model performance.
For demo purposes in this tutorial we will use one of the main famous datasets in Computer Vision - the Pascal VOC dataset that showcases the advantages of our training data quality assurance tools.
What are real-time statistics?
Supervisely calculates statistics on the first request and then updates them incrementally when the data changes, so the numbers stay current without a full recalculation. You find them in the Statistics tab of every project, next to the tools to train accurate neural networks and evaluate them.
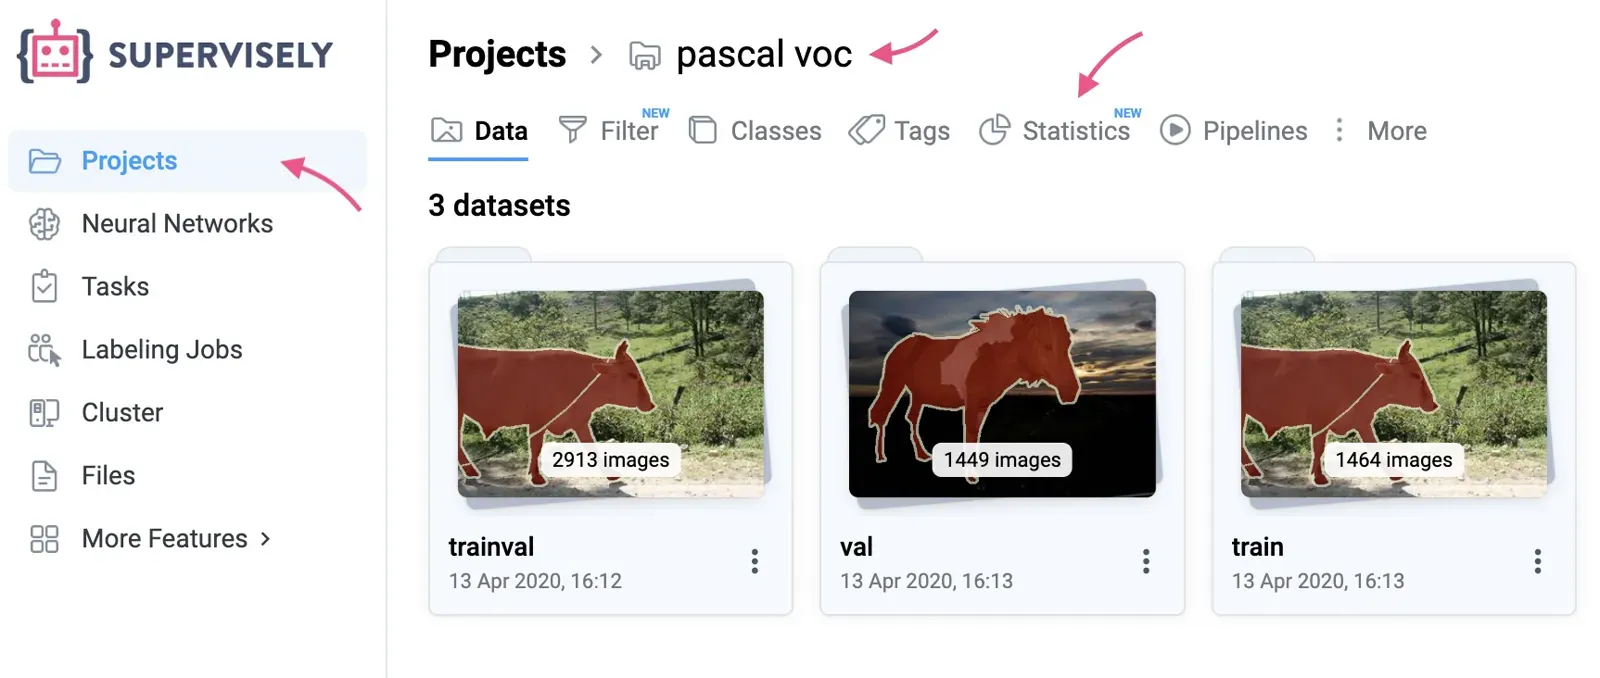 Open your project and click "Statistics" tab to navigate to quality assurance tools
Click a metric, review the matching images, and open the annotation toolbox in one click to correct the labels.
Because the numbers update as data changes, you see the effect of every edit right away, and the whole team works from the same figures when exploring outliers and fixing mistakes.
How do you preview annotated images fast?
Click any cell or row in the tables and charts to preview the matching images with annotations on top. Previewing thumbnails is the quickest way to spot missing labels, imprecise annotations and glaring mistakes before training. From the preview you can open all the images in the Image Annotation Tool.
How do you check class balance?
Class imbalance directly affects how well a network performs and generalizes. The Class Balance table shows which classes are rare or dominant, so you can collect and label more examples of the under-represented ones.
In the PASCAL VOC dataset below, person is the most frequent class with 3476 objects, while aeroplane has just 436. That is about 8 times fewer, so a model trained on this data may detect persons better than aeroplanes. You can also use the table to adjust data sampling during training and normalize the class distribution.
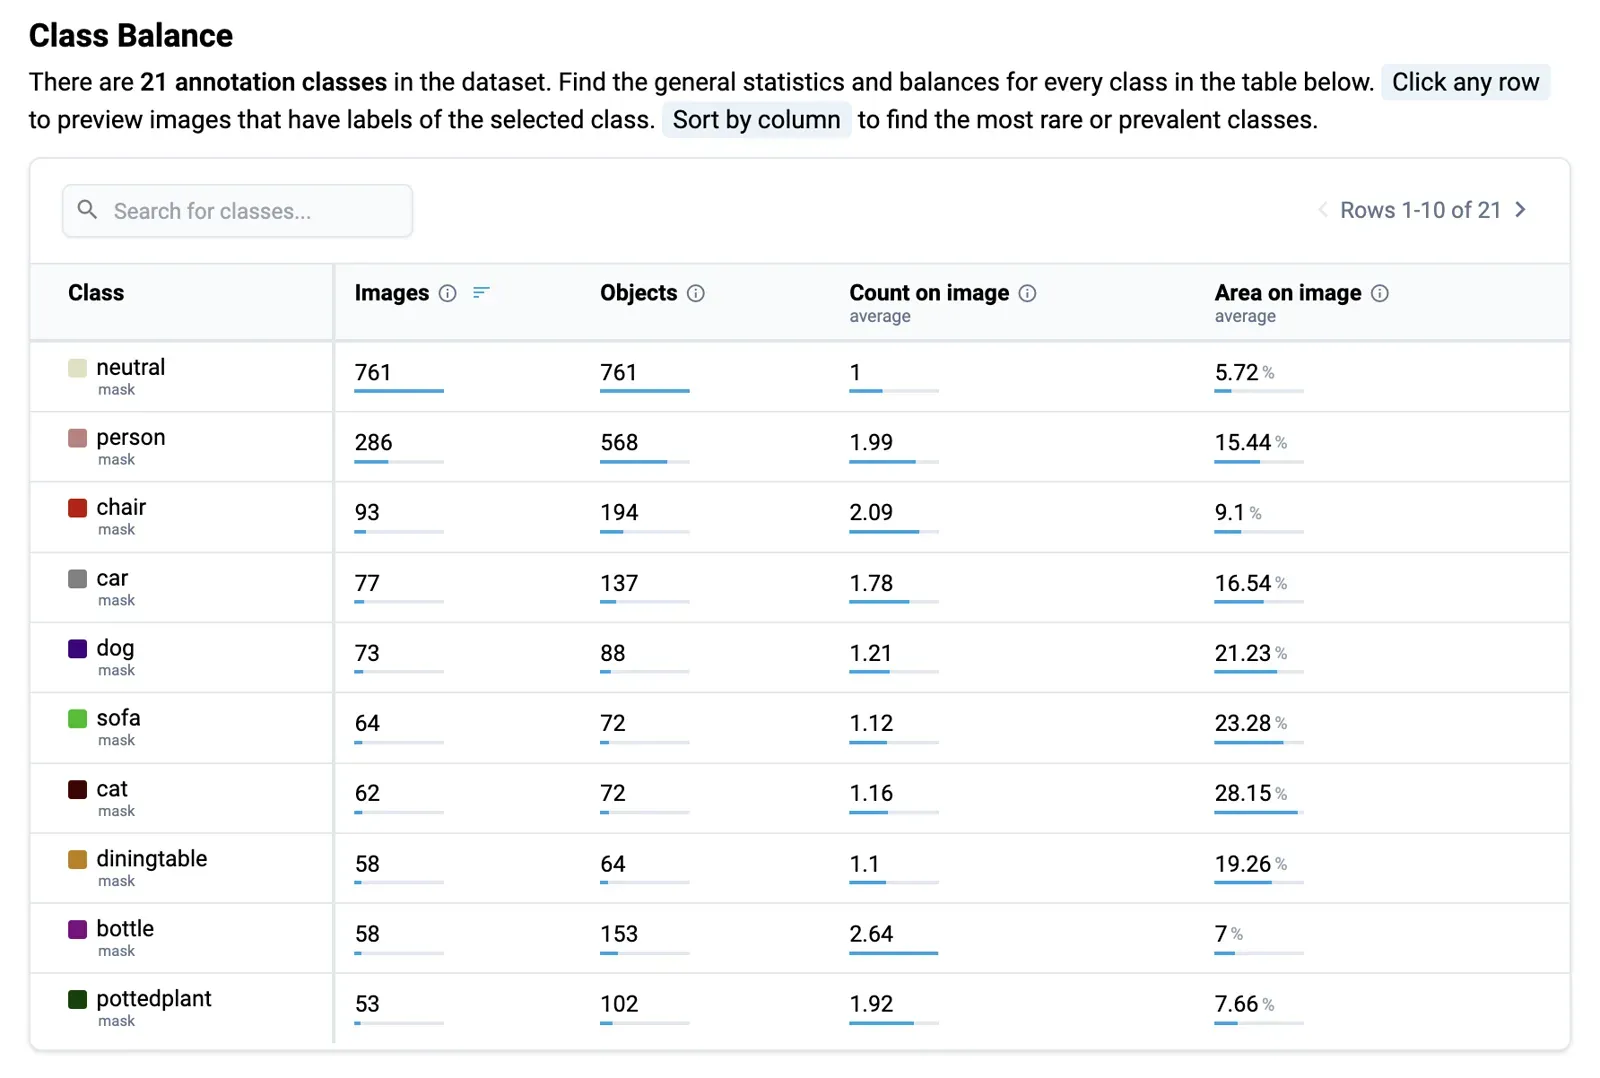 Class Balance statistic for the PASCAL VOC 2012 dataset
The columns are:
- Class: the annotation classes in the dataset (some datasets have thousands).
- Images: images that contain at least one object of the class.
- Objects: total objects of the class.
- Average Count on Image: average objects of the class per image, excluding images without it.
- Area on Image: average image area the class occupies, excluding images without it.
Click a row to explore all images with the class. Search finds a class in a long list, and Sorting shows the rarest or most frequent classes.
Once a dataset passes these checks, freeze it as a version so later edits do not change what you trained on.
What does the co-occurrence matrix show?
The Co-Occurrence Matrix shows how often objects of two classes appear in the same images. Some classes naturally appear together, such as cat and dog in domestic scenes, and unusual pairs often point to labeling errors.
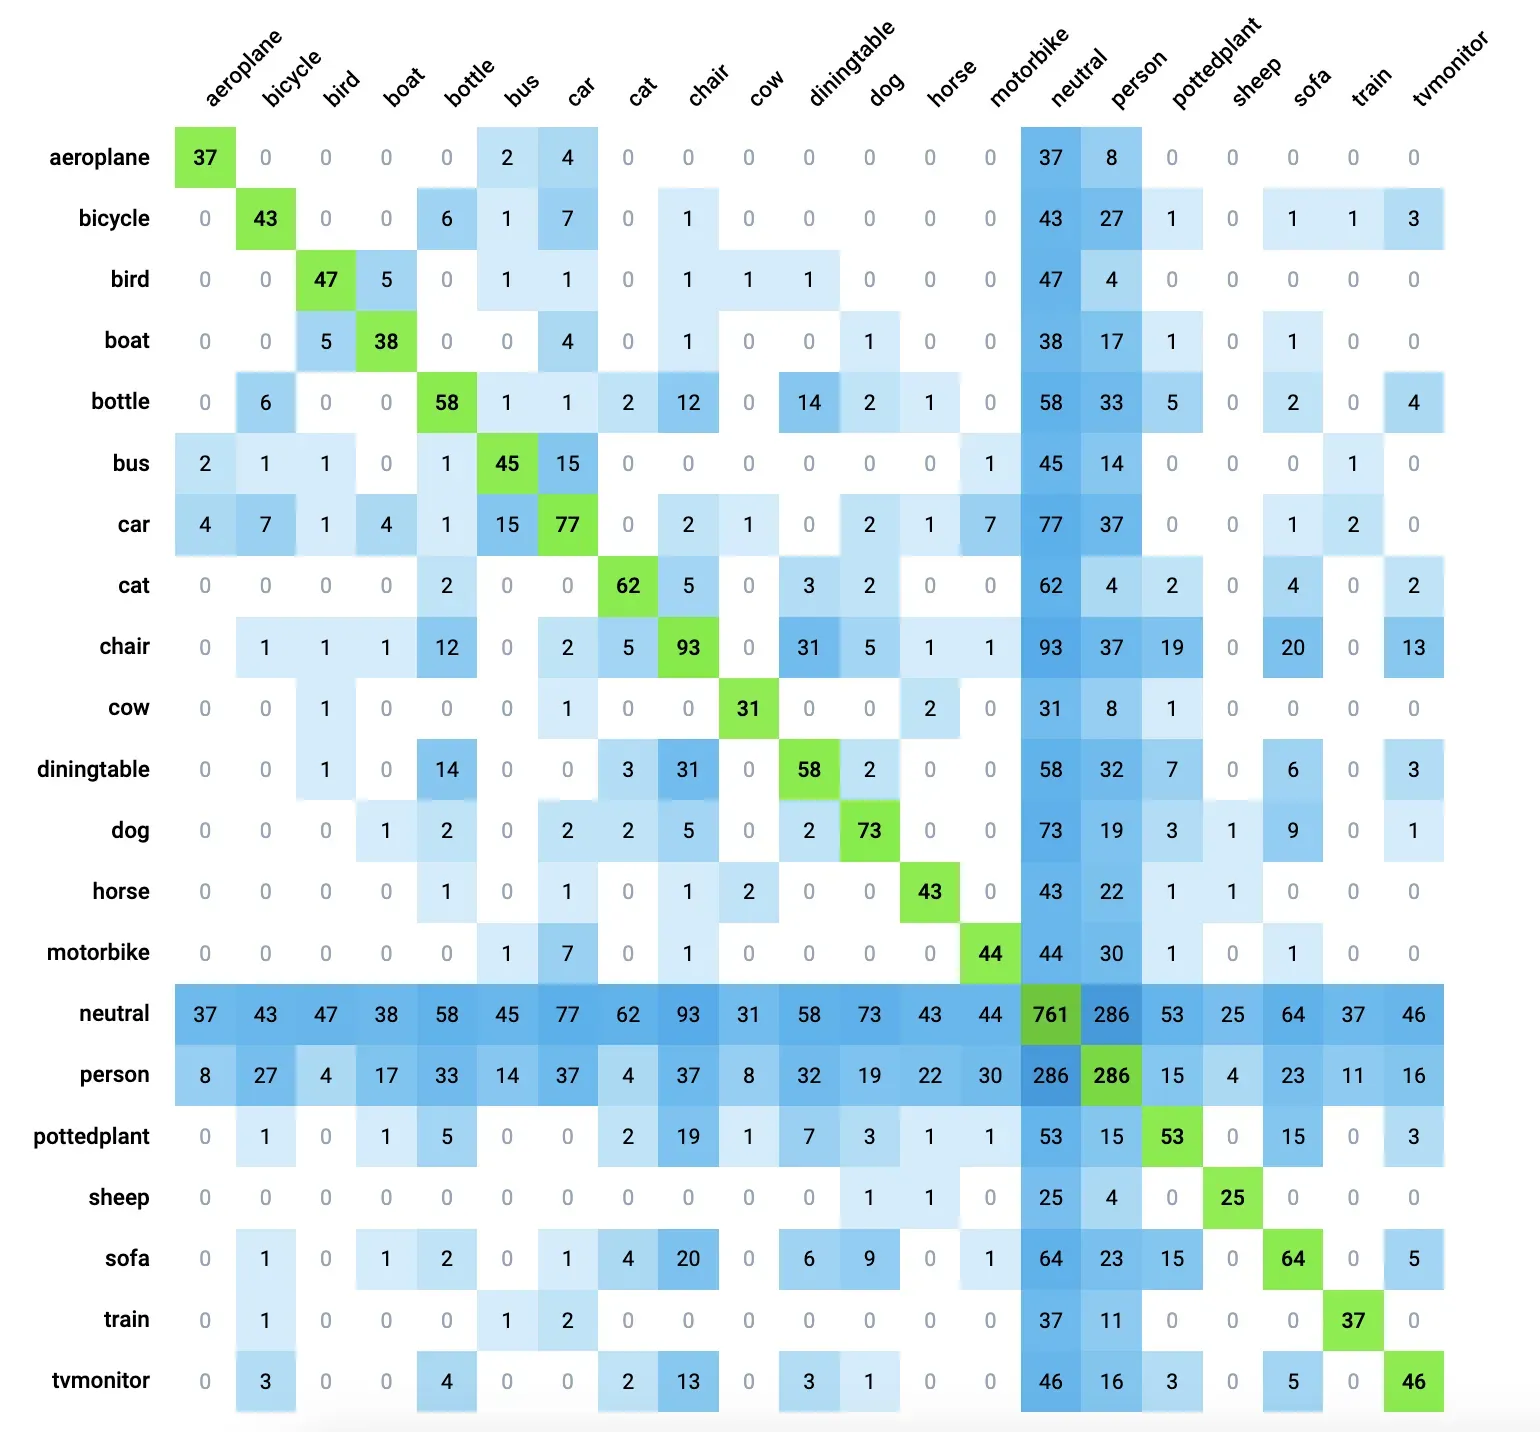 Co-Occurrence Matrix statistic for the PASCAL VOC 2012 dataset
For model predictions the same view is a confusion matrix: rows are the actual classes in the ground truth and columns are the predicted classes. If the cell for actual cat and predicted dog shows 7, the model got the location right but the class wrong for 7 objects.
Each cell holds the number of images with both classes. Hover over it for a tooltip, or click it to open those images with annotations.
How do you review statistics per image?
The Images table lists every image with its name, its split (training, validation or test), its dimensions in pixels, and for each class the number of objects and the area they cover.
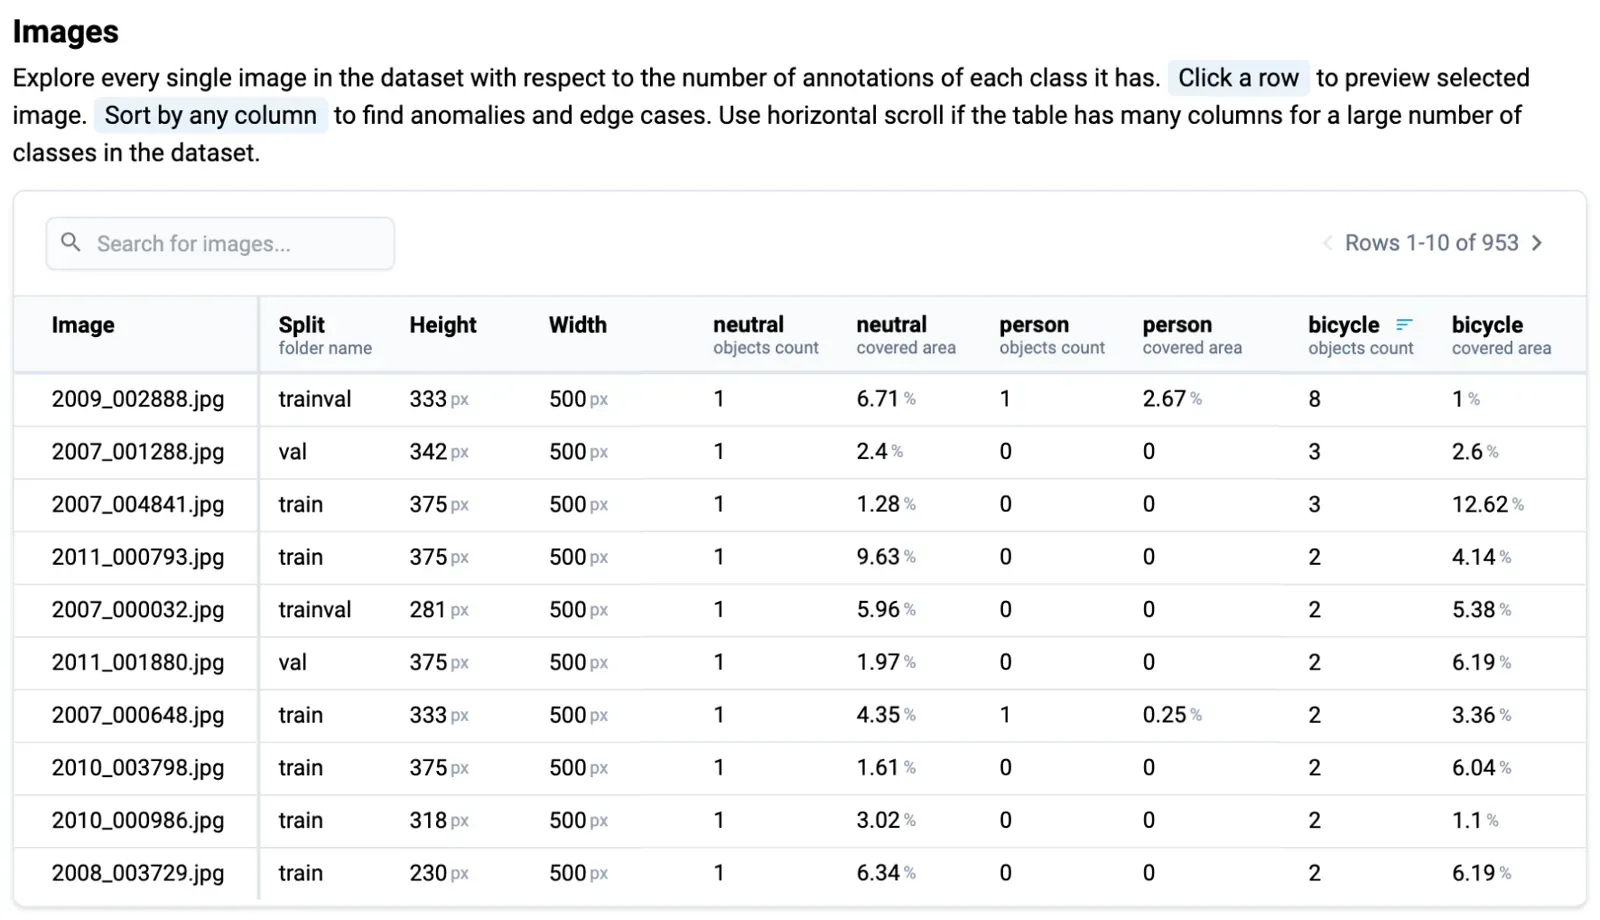 Image statistic for the PASCAL VOC 2012 dataset
Sort by any column to find anomalies, search for an image or class, and click a row to preview the image with labels. For example, sorting by class area can reveal images where one object covers 99% of the frame, which you may want to exclude from training. A reviewer can also sort by the car column, check the images with the most cars, then do the same for person.
How do you find images with too few or too many objects?
The Object Distribution Heatmap has classes on the Y axis and the number of objects per image (0, 1, 2, 3, and so on) on the X axis.
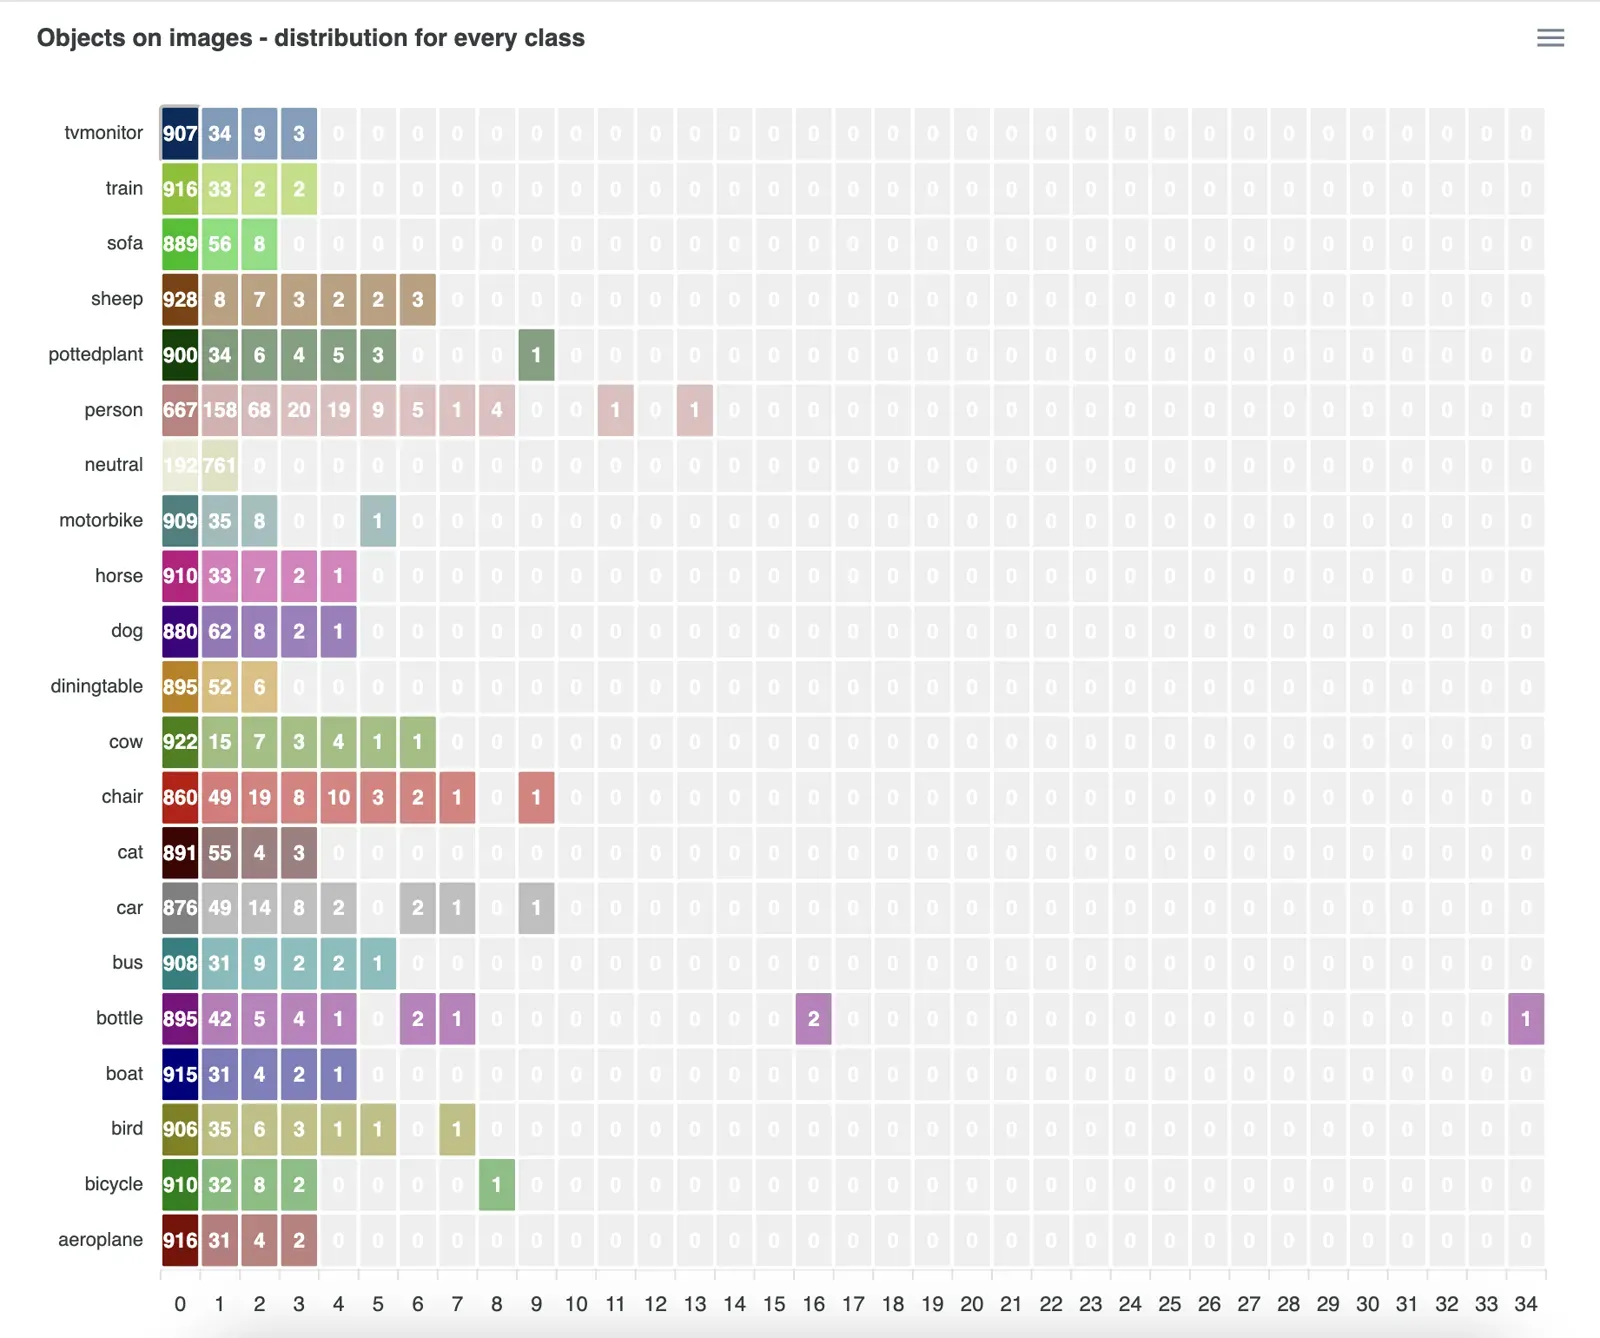 Object Distribution statistic for the PASCAL VOC 2012 dataset
For example, the cell for class train and 3 objects has the value 2, which means only 2 images have 3 objects of class train in the dataset. Hover for a tooltip, or click the cell to list those images and open them in thumbnail preview or the annotation toolbox. You can download the chart as SVG, PNG or CSV.
The advanced conditional dataset filters can find the same images, but they show a single cell. The heatmap shows the distribution across all classes at once.
What do the class size statistics show?
The Class Sizes table gives size properties for each class:
- Class and Object Count.
- Avg, Max and Min Area %: object area as a percentage of the image area.
- Height and Width (Min/Max/Avg): in pixels and as a percentage of the image side, in separate columns.
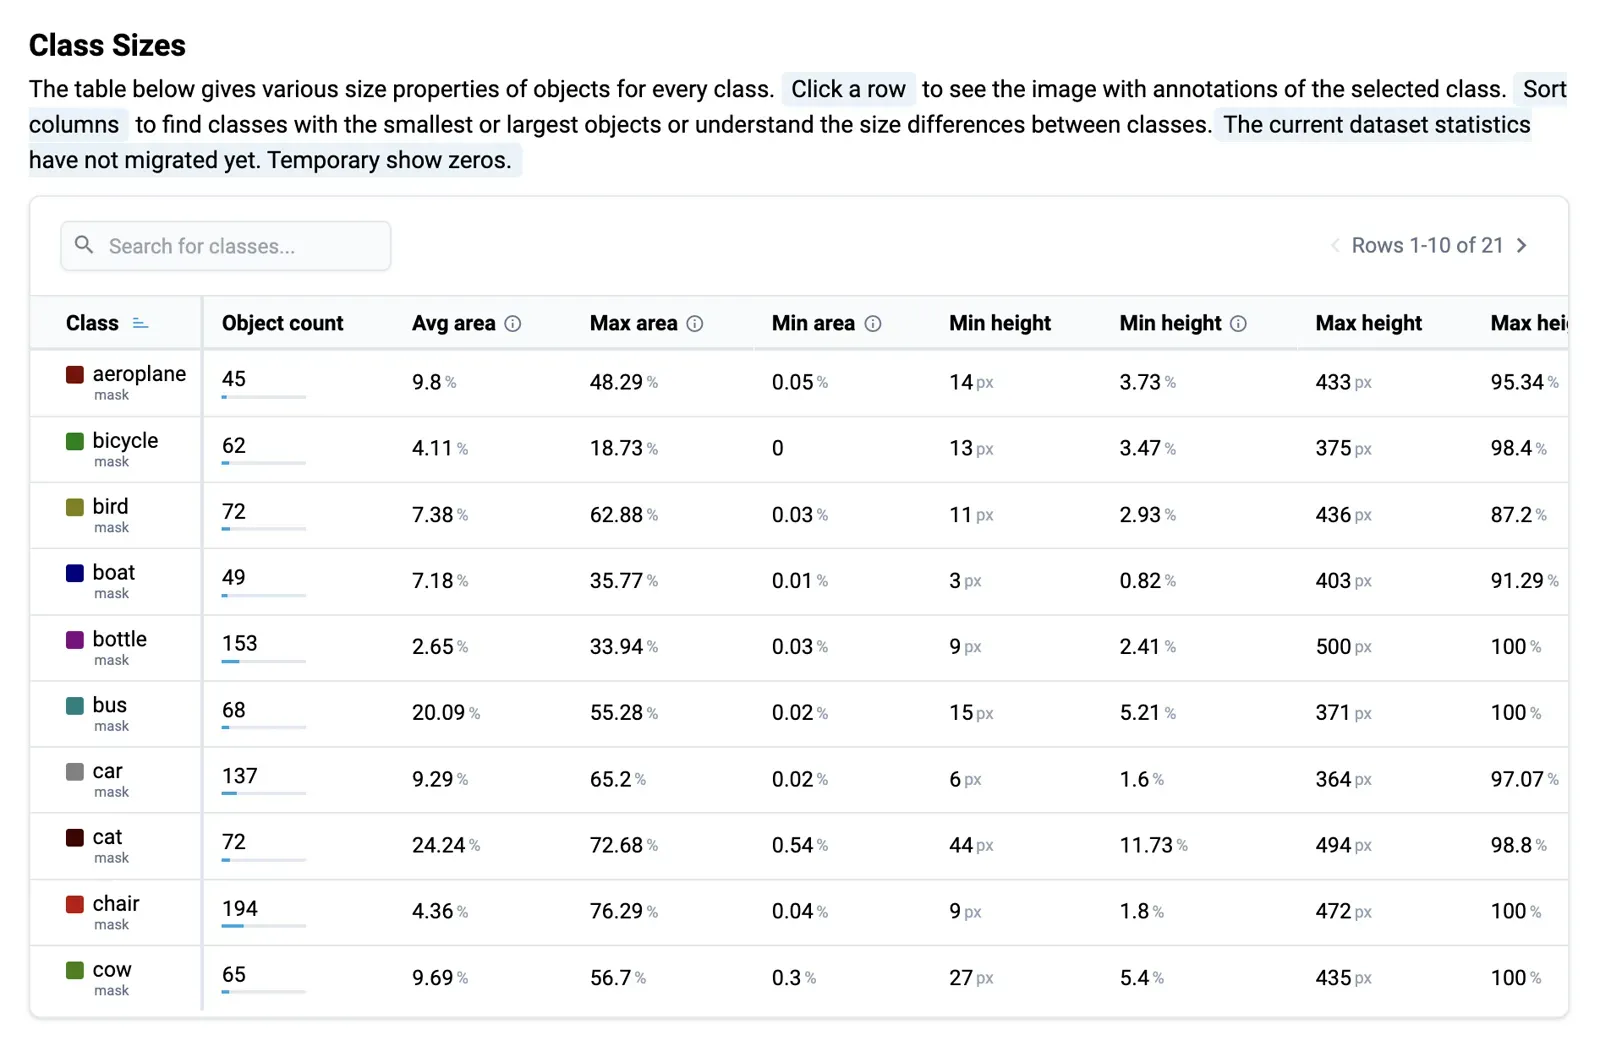 Class Sizes statistic for the PASCAL VOC 2012 dataset
Click a row to view images with all objects of the class, and sort columns to find the classes with the smallest or largest objects. Comparing sizes across classes helps find unusual shapes and tells the data team where the pipeline needs changes.
How does the class area treemap work?
The Treemap shows the same area data as colored rectangles: the larger the rectangle, the larger the average object area of the class. Hover for the class name and average area, or download the chart as SVG, PNG or CSV.
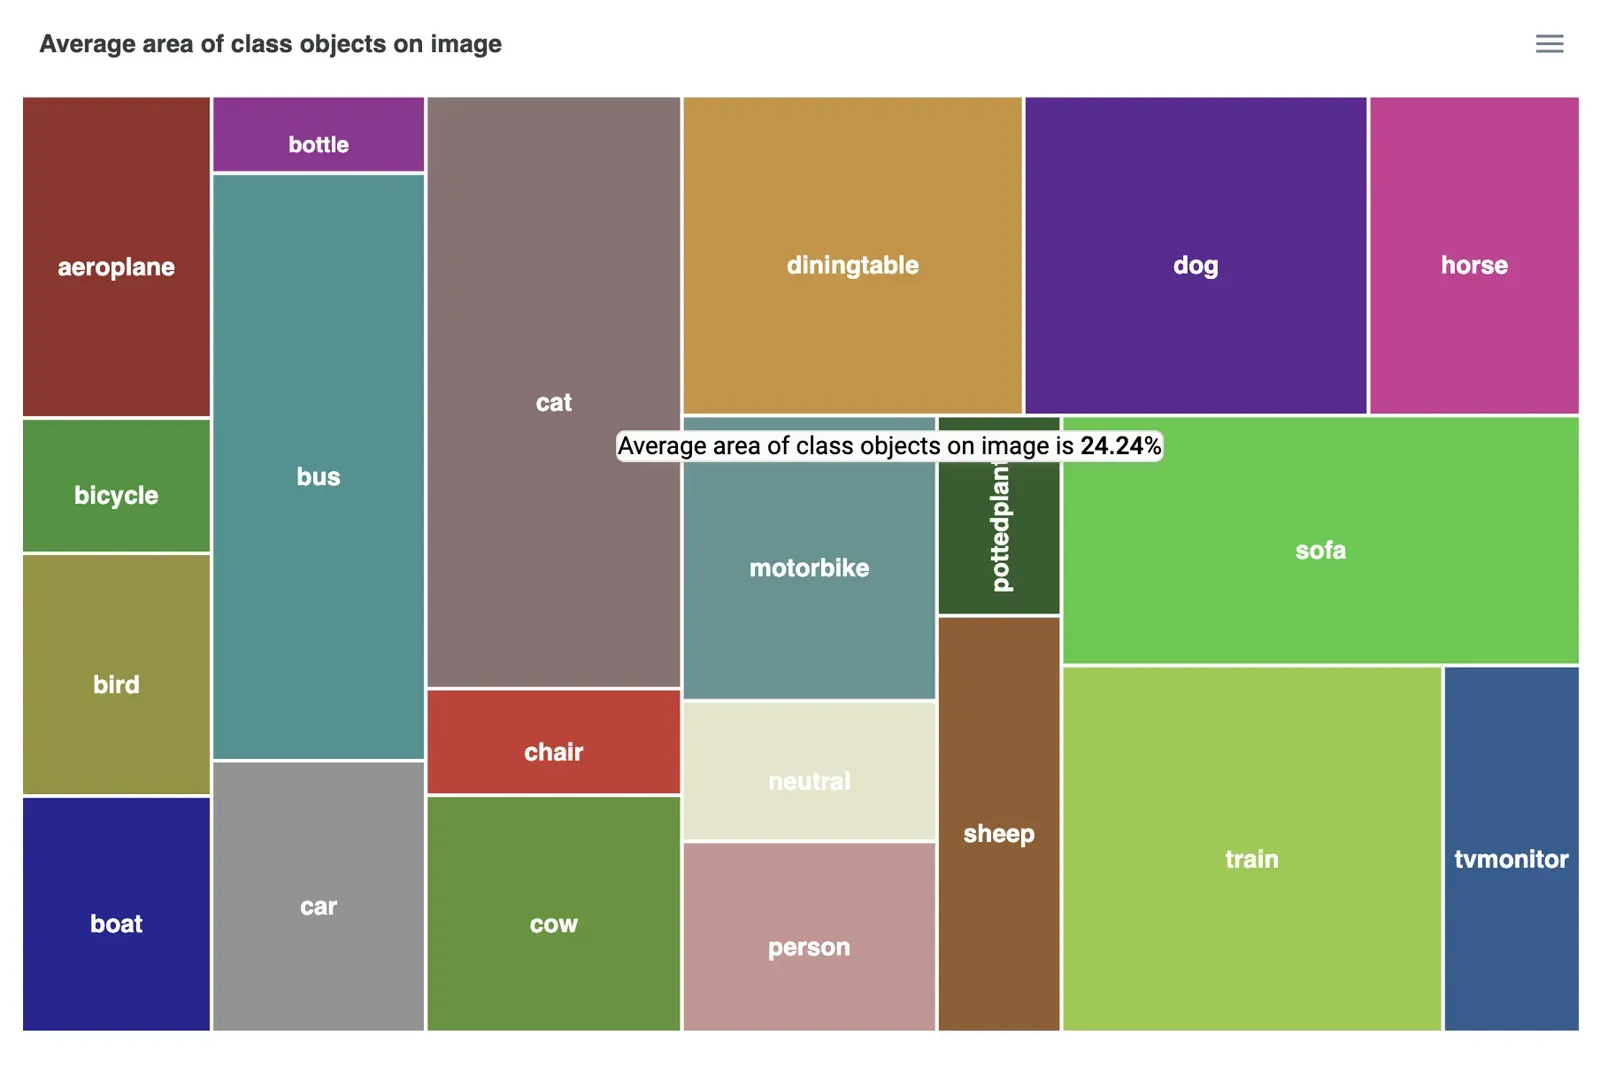 Class Area Sizes Tree Map statistic for the PASCAL VOC 2012 dataset
What does the spatial heatmap show?
The spatial heatmap shows where the objects of each class usually appear in the image. It is most useful for object detection and segmentation datasets. In the example below, airplane objects are mostly in the center, so you might configure augmentations that move them around and train a model that finds airplanes at any position.
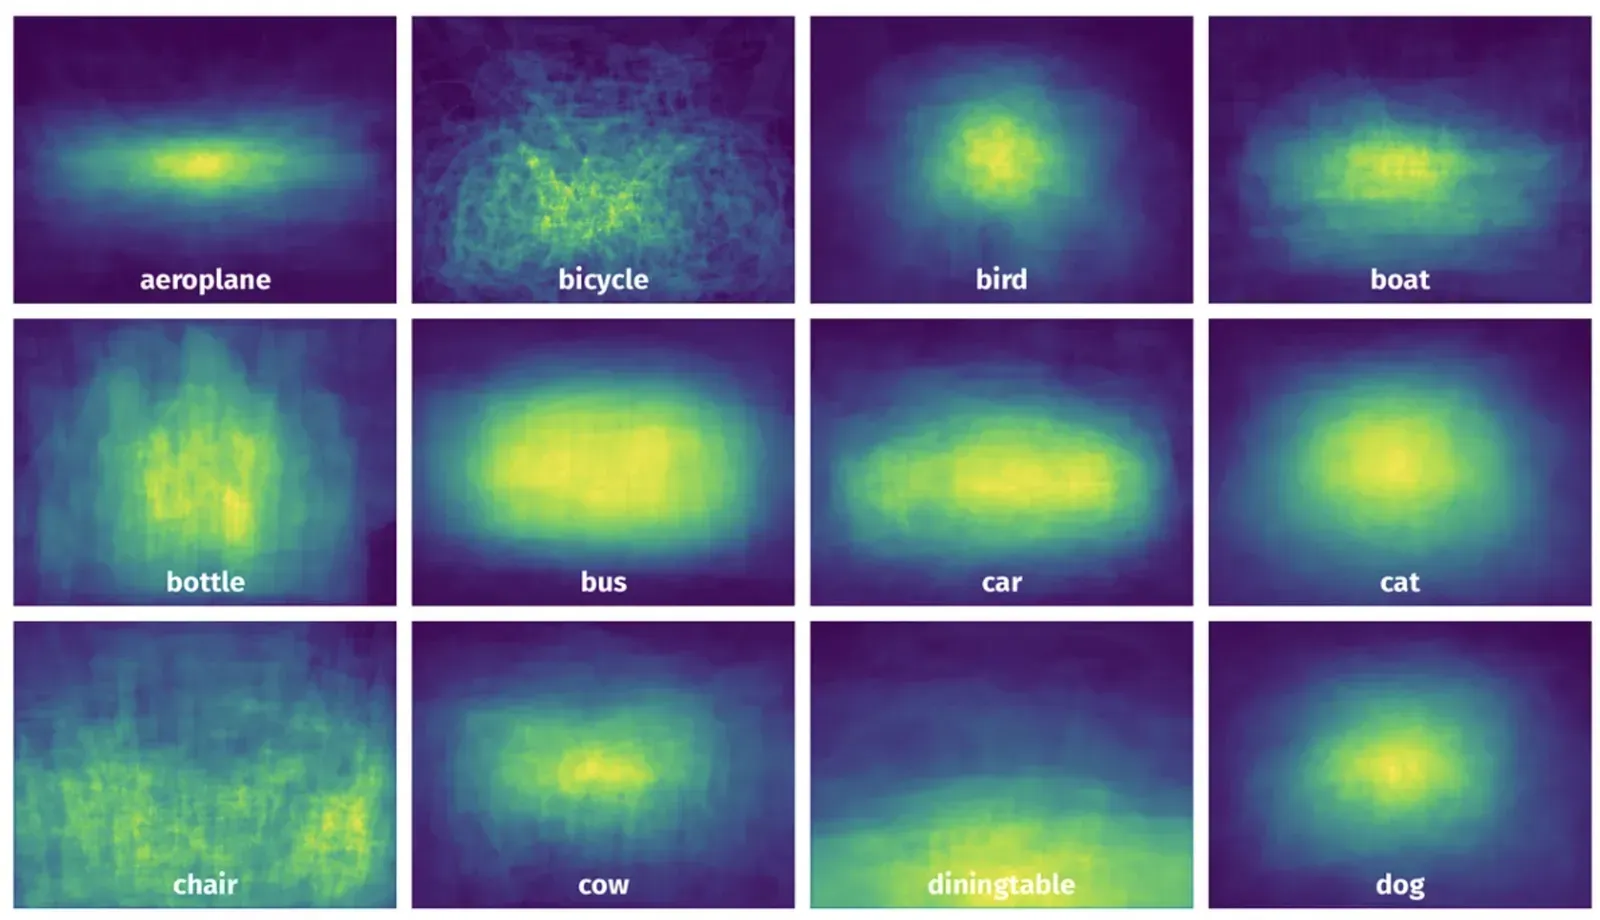 Spatial Heatmap statistic for the PASCAL VOC 2012 dataset
It also helps find labeling errors, because some locations are implausible: cars cannot be in the sky and should be in the road zones. For model predictions, compare the predicted locations with the average ground-truth locations to assess localization.
How do you inspect individual objects?
The Objects table lists every object with its ID, class, image name, image size, height and width (percent or pixels) and area as a percentage of the image.
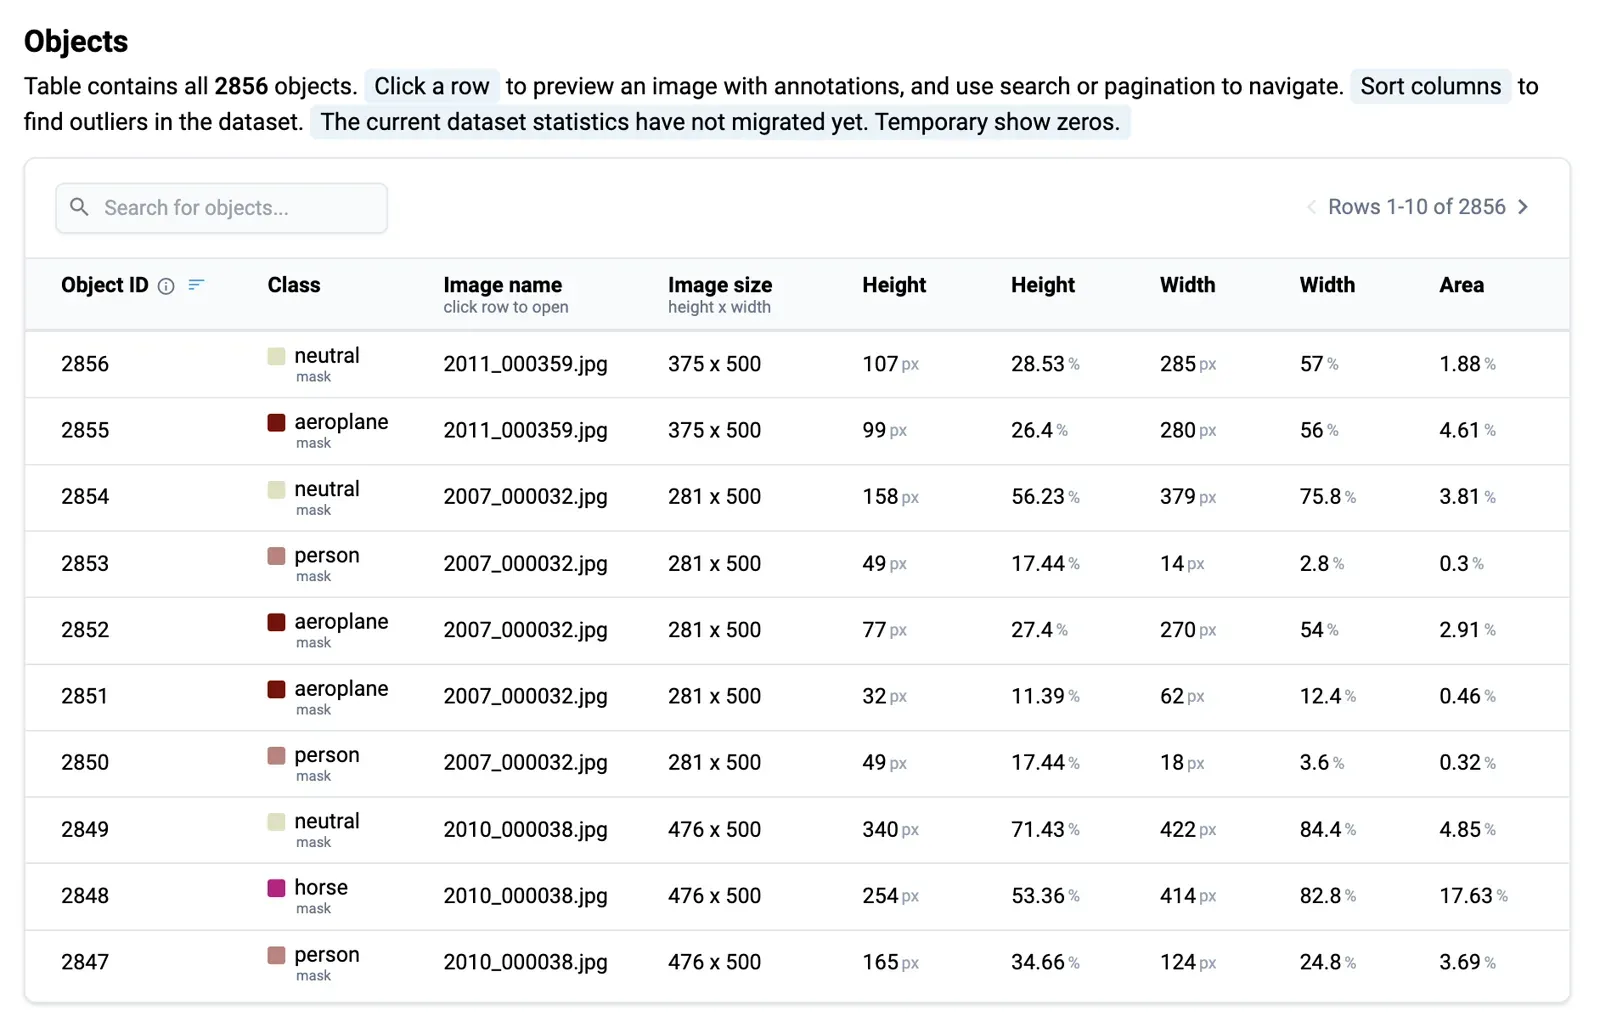 Objects statistic for the PASCAL VOC 2012 dataset
Click a row to open the image with its annotations, use search and pagination to navigate, and sort columns to find extreme values, such as the largest and smallest objects in the dataset. An object that covers the entire scene may hurt model training.
How do tag statistics work?
The co-occurrence matrix for image and object tags and attributes shows which tags appear together, and lets you find images that have both tag "A" and tag "B". In single-label classification the matrix should be diagonal, so anything off the diagonal is a likely mistake. For multi-label classification it shows the correlation between tag pairs. The example below uses the MVTec Logical Constraints Anomaly Detection dataset.
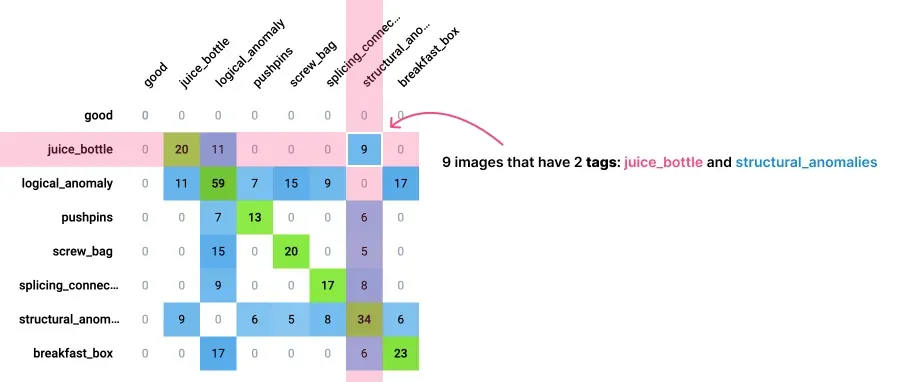 Image and object tags and attributes Co-Occurrence Matrix for the MVTec Logical Constraints Anomaly Detection dataset
Each cell holds the number of images in which the pair co-occurs. Hover for a tooltip or click to view the images.
Class and tag association matrix
This matrix shows which tags are commonly attached to objects of each class. In a livestock dataset, for example, the class cow may carry tags such as age, size, health condition and pose type. It also lets you search for objects by class and tag combination.
Categorical key-value tags distribution
You can create categorical (OneOf) key-value tags with a defined set of values. For every tag, the distribution chart shows how many objects and images carry each value. All cells are clickable and open the images in a thumbnail preview.
What other statistics are there?
The basic statistics cover Datasets, Images, Image Tags, Object Tags, Objects and Object Area, and show the general characteristics of the data and annotations.
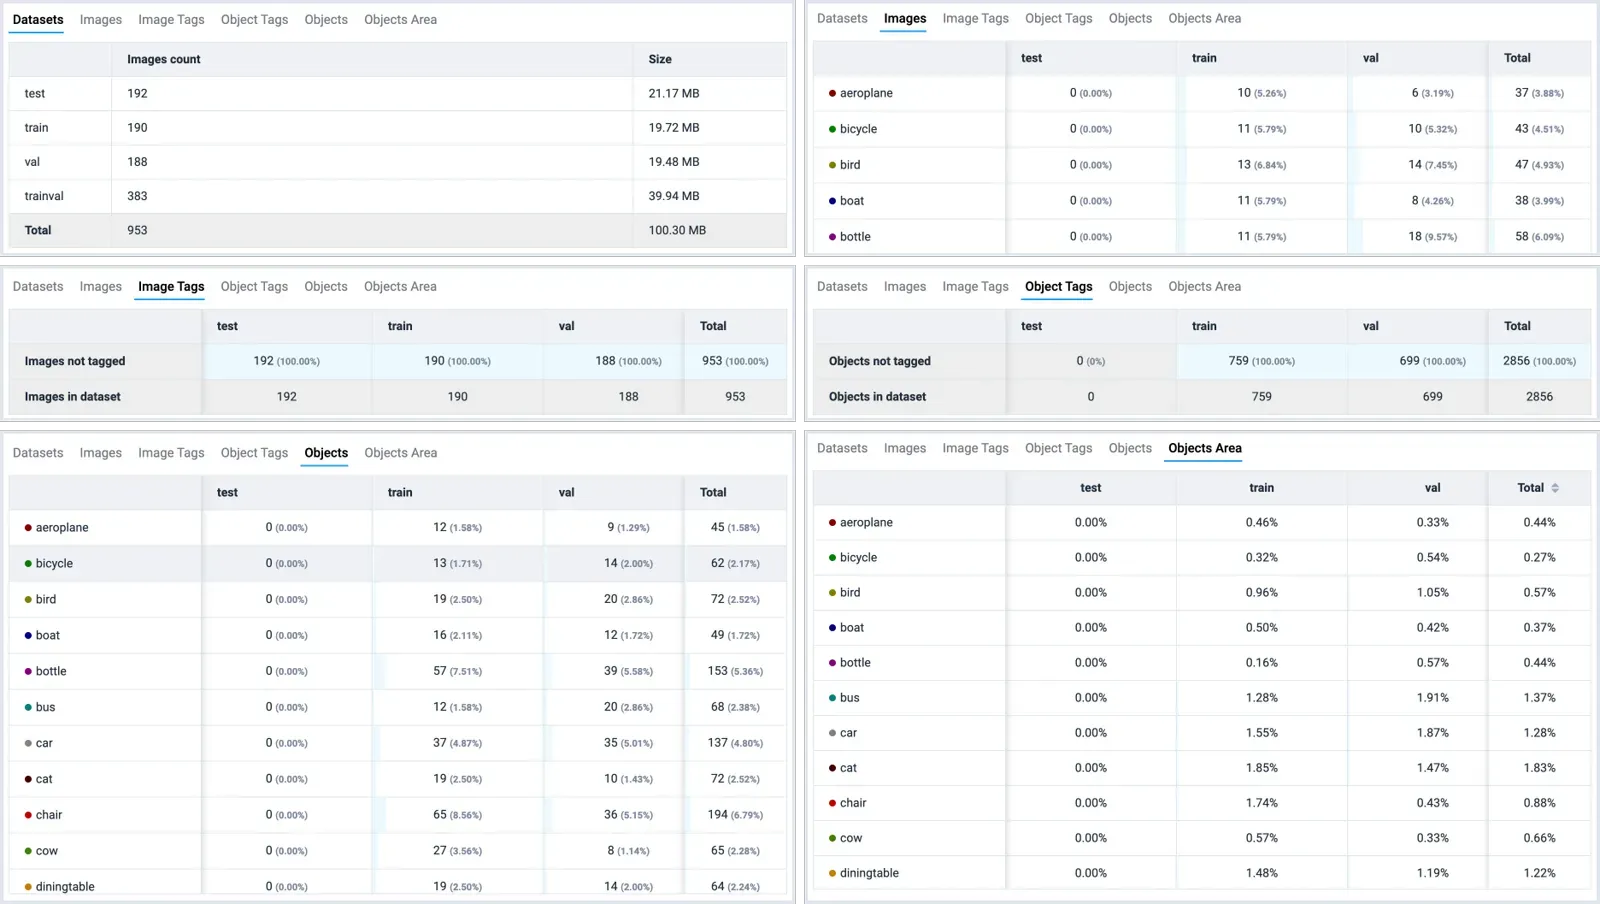 Other statistics for the, PASCAL VOC 2012 dataset
What can you do with the filtered data?
Statistics and dataset filters work as visual filters for subsampling data with very specific properties. You can then copy, move, delete or create labeling jobs from the selected images. Together with these tools, Supervisely forms a full-stack workflow:
You can build Active Learning and continuous model improvement pipelines from them.
The same statistics tools work on a self-hosted Enterprise install, so teams that keep data on their own servers can run QA across the whole team there.
How do you find annotation outliers?
Typical outliers are missing annotations, mismatched objects and disagreements between model predictions and ground truth. Three examples from the PASCAL VOC dataset follow.
Example 1. Missing or misclassified annotations
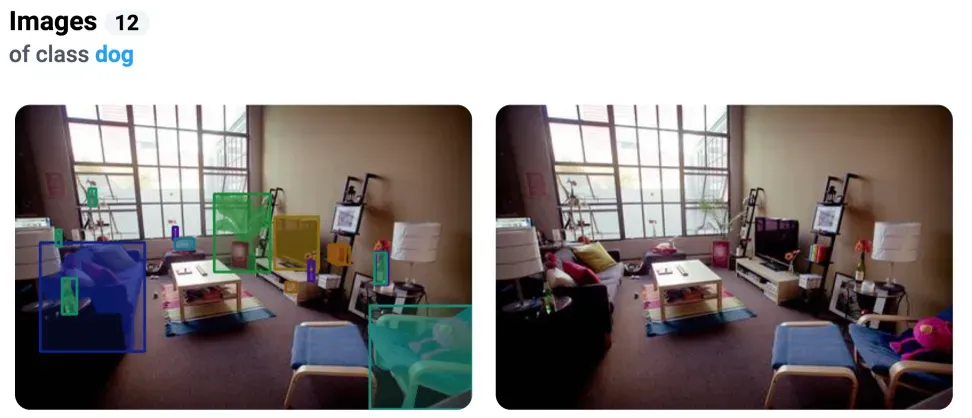
The class dog appears on 12 images. Reviewing them shows that one image has no dog at all, although an annotator drew a dog bounding box. That points to an unclear guideline or poor labeling quality.
Example 2. Mismatch in the number of objects
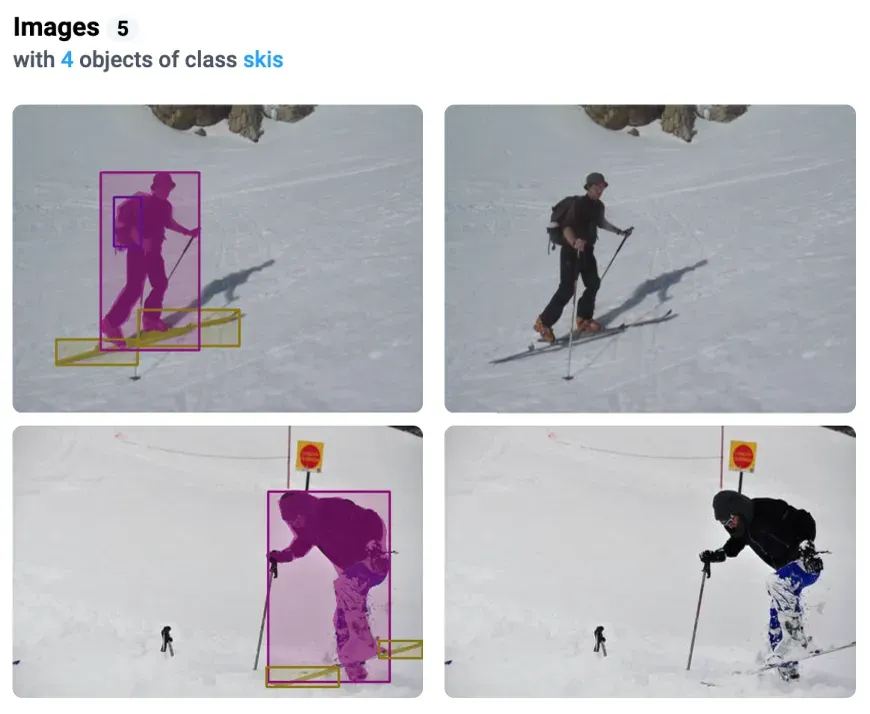
Sorting images by Object Distribution for the class skis shows that all of them have 4 objects. Some images do not actually show that many. Likely causes are one partly covered object labeled as two masks, duplicated objects, or labels that do not match the image.
Example 3. Errors in model predictions
In the co-occurrence matrix, an unusual pair such as horse and chair on the same image may reveal errors in the training data, a model that is not working properly, or too little data for some classes.
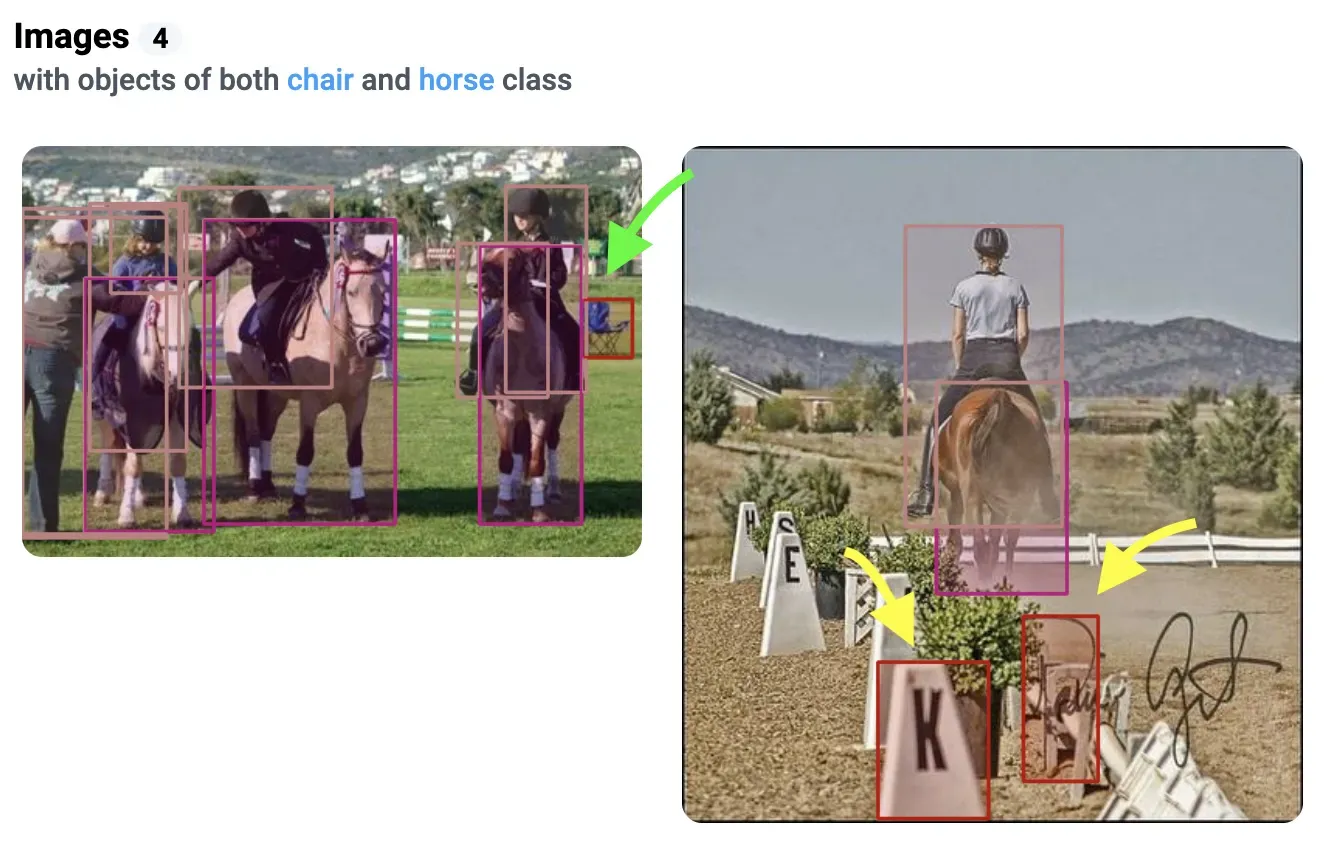 Green arrow - model correctly detected the chair on the left image. Yellow arrows - errors in predictions, objects are not chairs on the right image.
Analyzing predictions this way shows what data to add or how to improve augmentations. If the model misses chair, you might acquire and label more images of that class to improve class balance and model quality.
Conclusion: what to do next
Start with class balance, then look for outliers in object counts, sizes and locations, and click through to the images to fix them. Add sample review and annotator agreement for the quality of the labeling itself, and re-run the checks after every batch.
Frequently asked questions
What is data annotation QA?
Data annotation QA is the set of checks that confirm labels are correct, complete and consistent before you train a model. It combines dataset statistics, review of a sample by a second person, and agreement scores between annotators.
How do I check the quality of an annotated dataset?
Start with class balance and object counts to find gaps and outliers. Then review a random sample of images, compare annotators on the same images, and check model predictions against the labels. Fix errors, and repeat after each new batch.
How common are label errors?
Northcutt, Athalye and Mueller found at least 3.3% label errors on average in the test sets of 10 widely used datasets, and at least 6% in the ImageNet validation set. Your own data will vary, so measure it.
What are the best data annotation QA tools?
It depends on the check. Dataset statistics find imbalance and outliers, sample review and consensus scores measure annotator quality, and open-source libraries such as cleanlab flag likely label errors automatically. In Supervisely the first three are built into the platform.
What statistics does Supervisely show for a dataset?
The Statistics tab shows class balance, a class co-occurrence matrix, per-image statistics, object distribution, class sizes, a spatial heatmap, object properties and tag distributions. Every cell is clickable and opens the matching images.
Can I fix labels directly from the statistics?
Yes. Click a cell to preview the images with annotations, then open them in the annotation toolbox in one click. You can also copy, move or delete the filtered items, or create labeling jobs from them.